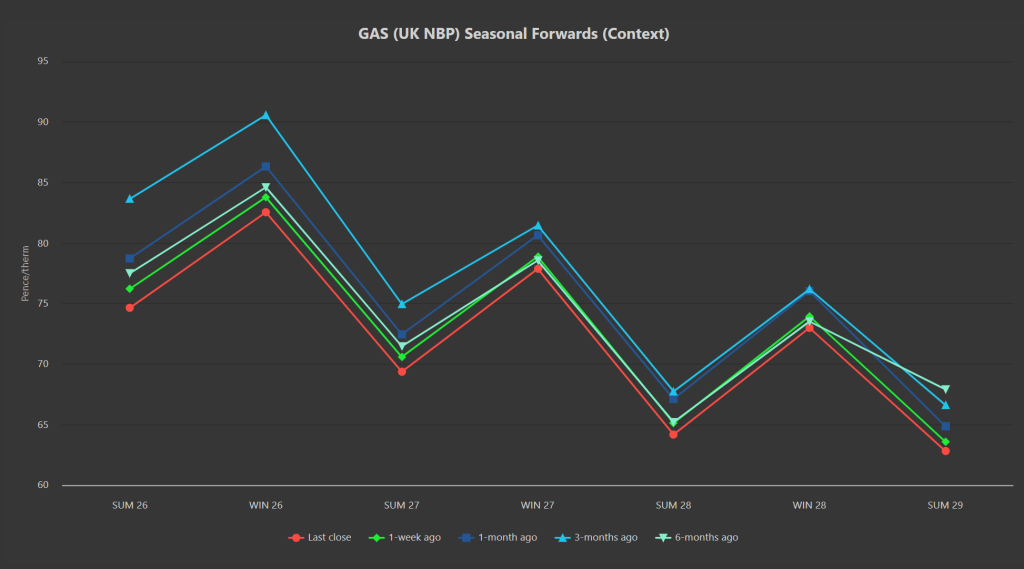
Seasonal Forwards (for all periods of delivery) are down versus 1-week/1-month/3-months/6-months ago (please see chart below).
Whilst market analysts are starting to get ‘wintry’ and referencing tighter fundamentals on the horizon (falling wind speeds and temperatures), in reality, the opposite is true.
Warm temperatures are offsetting any talk of patchy wind outputs, and supply fundamentals are in very good shape.
Freeport LNG (Texas), is ramping up again following the weekend outage.
Amid falling Russian LNG deliveries to Europe, Russia’s Arctic LNG 2 saw exports to Asia surge 21% in Oct ’25 (easing global competition for cargoes).
Off the back of stable US LNG arrivals, EU imports are on track to hit a 7-month high in Nov ’25, reflecting an increasingly strong underlying sentiment of improving energy security.
This security is further evidenced by Europe’s rapid LNG terminal expansion to 286 bcm by mid-2026 equating to an average utilisation of 52% – pointing toward a glut of gas in the coming years (and, no doubt, falling commodity costs).
Whilst Ukraine is keen to continually reiterate its readiness for peace talks (so long as its understood territory concession is not a consideration), Russia’s sustained territorial demands reflects an impasse, and will keep geopolitical risk premiums elevated across energy markets.
In other news, frequent negative power prices in Spain (due to excessive renewable generation amid low demand) is likely to slow renewable capacity growth jeopardising the country’s 2030 green energy targets, and surely signalling a wider trend across Europe.
On the storage front (as you’d expect for the time of year), we’re starting to see an increase in net withdrawal days (as opposed to net injection) as the storage charts begin to plateau, before likely rolling over into constant withdrawal beginning mid-November, lasting until mid-March.
European storage fullness remains at 83% versus the 5-year average of 90%.
Monthly Day-Ahead averages for October came in at 78p/therm (or 2.67p/kwh exc. non-gas).
Monthly Day-Ahead averages for November so far are at 75p/therm (or 2.56p/kwh exc. non-gas).
Winter is coming – just not yet!
ELECTRICITY & CARBON
Electricity prices are seeing a more modest drop-off compared to gas – nonetheless, the front 3-Seasons are rolling over despite the prospect of winter supply tightness around the corner.
On the Carbon side of things, UKAs are increasingly correlated to EUAs (following the “common understanding” reached between the UK/Europe to link emissions markets at the UK-EU summit in London on 19th May).
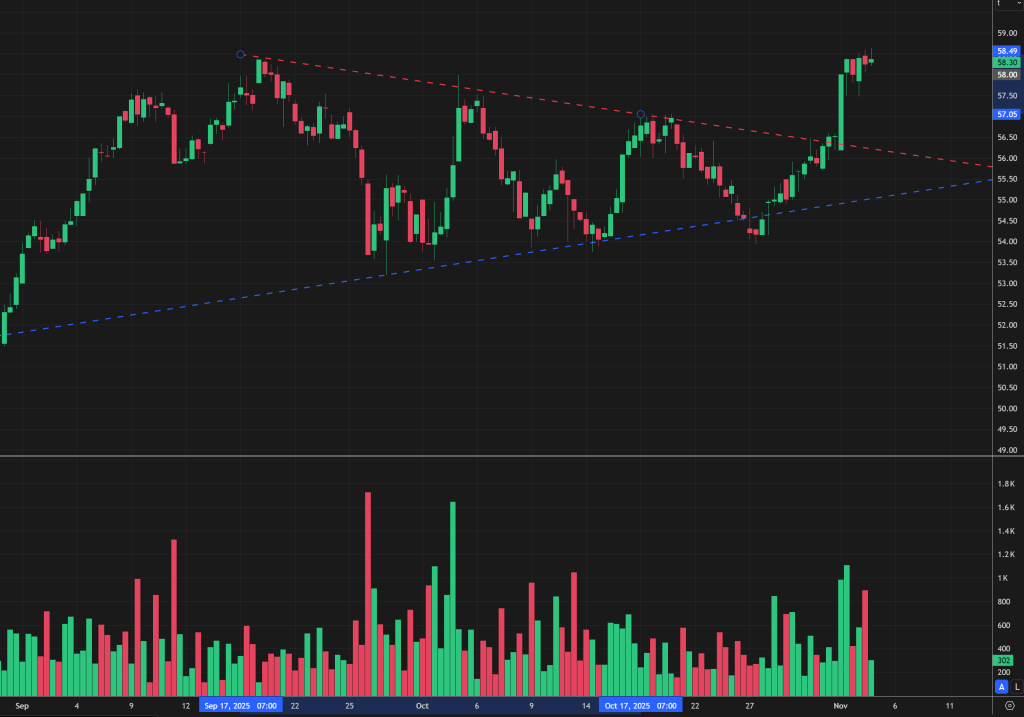
Whilst UKAs went back up to retest £56/tn as we predicted, I’m afraid the consolidation triangle/pennant that’s been in place since mid-Sep then broke abruptly to the upside off the back of very high trading volumes (please see chart below).
Yesterday saw very big trade volumes in EUAs – the catalyst for this latest bullish move was the German government announcing their intention to introduce an industry power price from the beginning of the new year.
Under the plan, the industry power price could see a fall of up to 50% of the yearly average wholesale price for potentially 50% of the user’s consumption.
Should the plan go ahead, any savings made will be invested into steps to further deccarbonise – which has been construed as a shot in the arm for European activity/outputs.
Of course, more industrial activity means more emissions, means an increased volume of credits required, means higher EUA/UKA values.
Whilst the subsidy will need to come from somewhere, it’s worth noting that Germany has a great deal more headroom for infrastructure spending than the UK – Germany’s debt to GDP ratio being 63.8% (whereas the UK’s is 95.3%).
Frustratingly, it’s estimated that 80% of EUAs/UKAs are held by speculative funds – only 20% are held by Compliance Buyers/Industrials.
Most of these funds are based out of North America – conspiracy theories abound that the US stands to benefit by turning the screw on European competitors by talking Carbon up.
Suffice as to say, whilst UKAs remain at a 15% discount to EUAs, the market is becoming increasingly inefficient for Industrials, and more akin to a speculative instrument.
Today’s UK electricity generation mix is bearish in nature – specifically, renewables are contributing 40%, thermal at 22% (gas and coal) and low carbon at 18% (nuclear and imports).
Monthly Day-Ahead averages for October came in at £70/mwh (or 7p/kwh exc. non-energy).
Monthly Day-Ahead averages for November so far are at £58/mwh (or 5.8p/kwh exc. non-energy).