It’s now been confirmed that Iran’s retaliatory strike on Qatar has severely disabled a major gas facility, likely meaning a global supply crunch that could be with us for several years.
Concern across the markets this morning has noticably shifted from near-term worries (Summer-26) to mid/long-term impacts (Winter-26 and beyond).
It’s increasingly difficult not to think that the escalating impacts of war on Iran is playing into Trump’s hands – the US as a net-exporter of oil/gas stands to be the main beneficiary if the Persian Gulf production is hamstrung.
The wars in Ukraine and now Iran, have shifted the weighting of the global LNG market – the U.S. was the highest LNG exporter in 2025, and Trump has made no secret of his willingness to expand production and exports going forward.
The US accounts for around 60% of Europe’s LNG imports, while Qatari LNG exports historically supply Asian countries.
Qatar Energy have announced that 17% of its LNG capacity has been wiped out for 3 to 5 years following Israel’s allegedly unsanctioned attacks – this equates to a 4% global LNG supply shortfall this year.
This coupled with the Strait of Hormuz remaining shut, and the impending maintenance season of the Norwegian pipeline/fields, leaves Europe/the UK with a serious problem – not just in the short-term, but for the foreseeable future.
Inevitably, competition for cargoes in the coming months will be fierce with the heating season coming to an end and all eyes on storage replenishment – Europe will be fighting over US imports with South Korea and China.
Impotent EU leaders can only voice growing concern over the deteriorating economic outlook with the EU looking down the barrel of a recession, and are calling for a temporary halt to strikes on energy infrastructure.
According to the ECB, an extended disruption could push euro‑area inflation to 6.3% , with gas prices climbing to their highest levels since the Ukriane invasion.
Meanwhile, the US has outlined moves to boost oil and LNG exports – and so, perhaps, Trump’s motives for enflaming the Middle East are becoming clearer.
It’s also worth noting that investment funds have increased their net long positions in TTF (benchmark European gas) over the last couple of weeks by more than 600%, further supporting the upward momentum of forward prices.
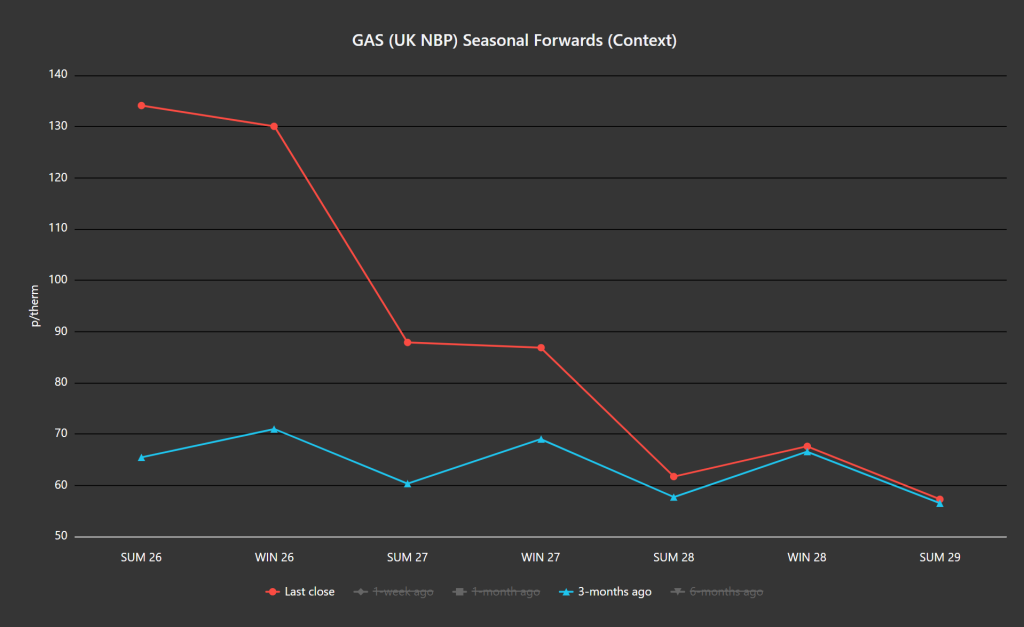
Not surprisingly, the shape of the whole curve is now shifting – not just the near-term, but the mid-term has also lifted.
The chart below shows just how badly Trump’s war has impacted prices since mid-Dec ’25 (when it looked as though Europe/the UK would be enjoying a soft-landing beginning Summer-26, with a glut of LNG on the horizon).
Monthly Day-Ahead averages for the month are slightly up – currently at 127p/therm (or 4.35p/kwh).
ELECTRICITY & CARBON
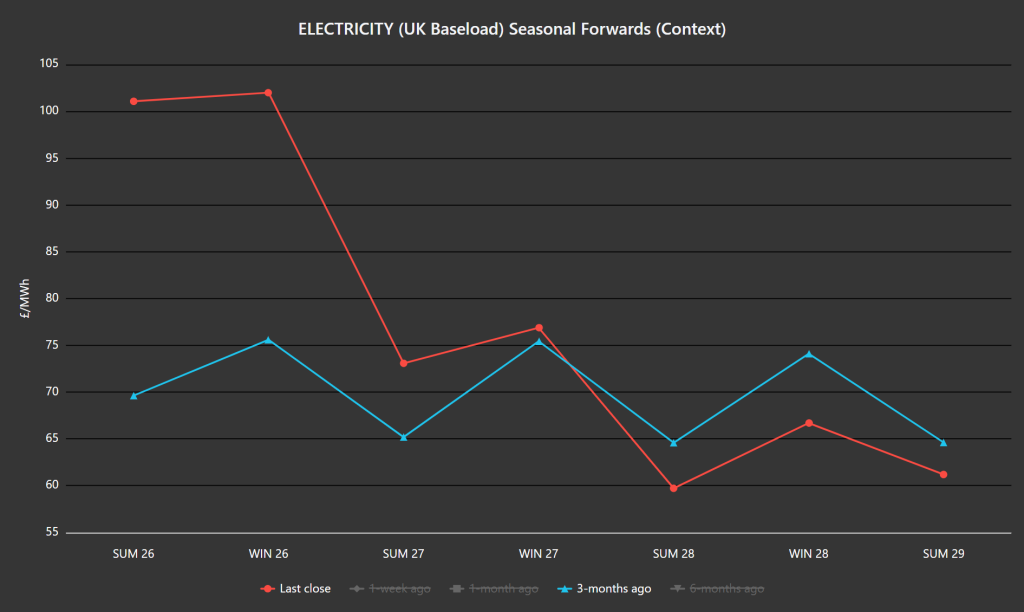
The chart below again shows Seasonal Forwards at yesterday’s close versus 3-months ago – notably, electricity Forwards have (to date) been less severely impacted than gas prices.
On the Carbon side of things, Dec-26 UKA delivery remains uncoupled from gas volatility with prices touching levels that are 41% below those printed in mid-Jan amid fears that Trump’s war on Iran is slowing global economies (and, in so doing, Industrial outputs).
At the time of writing, UKA mid-price Dec ’26 delivery is at £36.52/tn (and the spot is at early-35s).
Monthly Day-Ahead averages for the month so far are mirroring near-term gas prices – currently at £105/mwh (or 10.5 p/kwh).