Once again, Trump spent the weekend keeping markets guessing – initially, on Saturday, with talk of “winding down the war”, then, on Sunday, threatening Iran with a deadline of “48-hours” to open up the Strait of Hormuz, or else face the destruction of key energy infrastructure.
Fast-forward to this morning, and Trump would have us believe that diplomacy is underway, and three countries are mediating a complete end to all hostilities – not surprisingly, front-end prices have dropped as much as 15%.
Europe’s storage fullness is at 28% versus the 5-year average of 38% – the EU’s energy chief has urged member states to begin filling storage early to avoid supply shortfalls later in the year (easier said than done given prevailing volatility).
Nonetheless, optimism amongst market participants persists (most likely because Trump continues to vacalise his intention to curtail the offensive).
According to a Bloomberg “survey of strategists”, European stocks are expected to recover from the market turbulence caused by the Iran war and reach new record highs by year‑end.
Apparently, these same strategists view the offensive as a temporary shock which is unlikely to derail EU growth.
However, Trump will need to get a move on if this morning’s price falls are to gather pace.
QatarEnergy is soon expected to declare a longer term force majeure, with 17% of Qatar’s LNG exports impacted by damage to 2 trains – which equates to around 4% of global LNG volume.
The global gas industry will need to quickly demonstrate that it can survive for several months without Qatari gas (both by increasing supply from other producers and by destroying gas demand) in order to convince investment funds (and all physical gas holders) that prices have more potential to fall than to rise – for now, investment funds still see oil and gas as a safe long position.
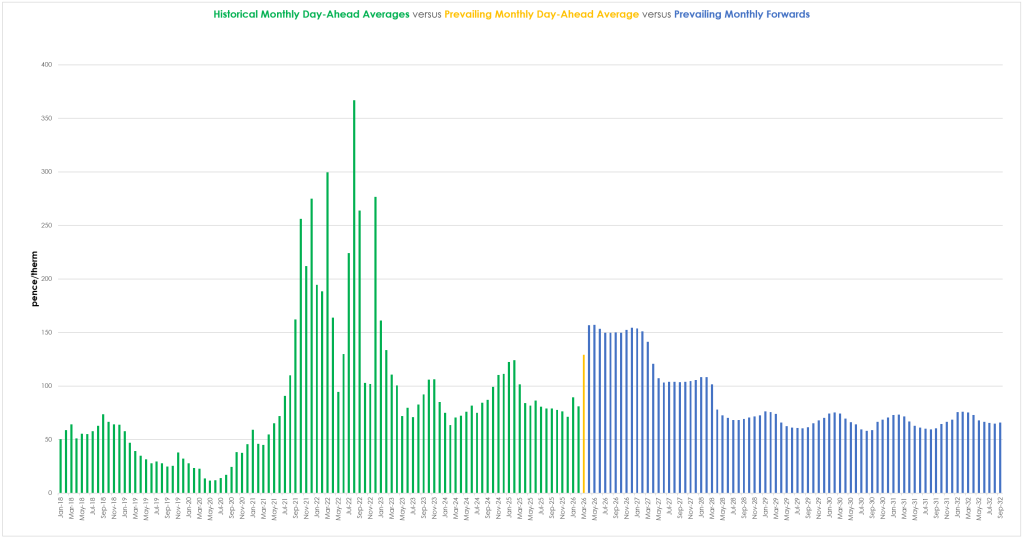
The chart below shows Historical Monthly Day-Ahead Averages (green columns), prevailing Monthly Day-Ahead Average (single orange column), and prevailing Monthly Forward prices.
Notably, near-term Monthly Forward prices for the coming summer are higher than the prevailing Monthly Day-Ahead Average for March so far.
Does this mean the risk-premium in near-term Monthly Forwards is overcooked?
Well, with only 8 days left before the onset of Summer-26 remaining, time is running out for buyers hedge out the front Season – however, hedging the front Month/Quarter remains a viable option and allows buyers a little more time to see how the latest talk of diplomacy plays out before pulling the trigger.
Monthly Day-Ahead averages for the month are still on the up – currently at 129p/therm (or 4.4p/kwh).
ELECTRICITY & CARBON
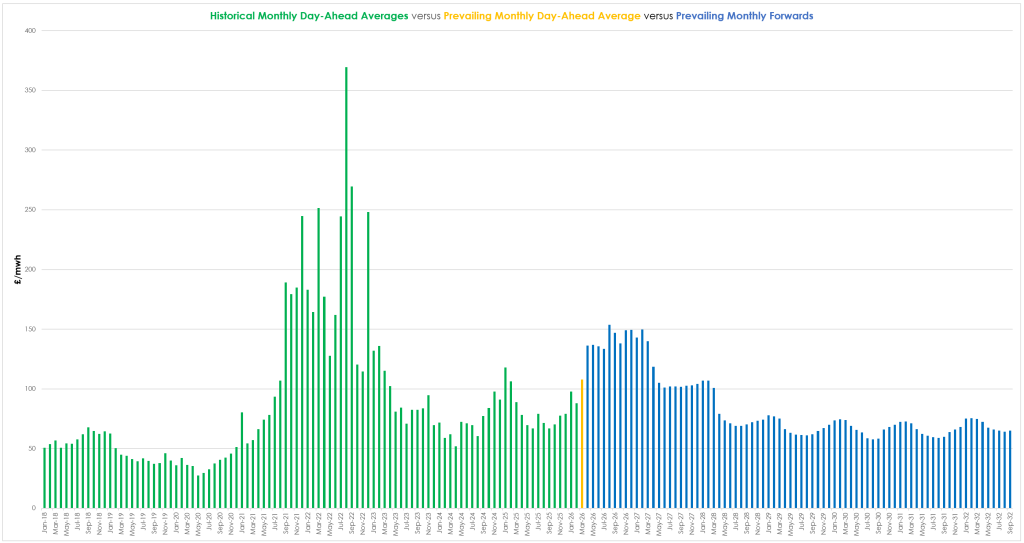
As with gas prices, notably, the electricity chart below shows that near-term Monthly Forward prices for the coming summer are higher than the prevailing Monthly Day-Ahead Average for March so far.
On the Carbon side of things, Dec-26 UKA delivery remains uncoupled from gas volatility with prices touching levels that are 39% below those printed in mid-Jan amid fears that Trump’s war on Iran is slowing global economies (and, in so doing, Industrial outputs).
At the time of writing, UKA mid-price Dec ’26 delivery is at £37.91/tn (and the spot is at early-36s).
Over the last couple of weeks, when gas falls, UKAs firm up – and vice versa.
Monthly Day-Ahead averages for the month so far are mirroring near-term gas prices – currently at £108/mwh (or 10.8 p/kwh).