Last night, less than two hours before Trump’s midnight deadline (GMT), a Pakistani-brokered ceasefire was agreed (and the world breathed a collective sigh of relief).
Not surprisingly, this morning markets were significantly down, particularly at the front-end.
Prices have continued to slide throughout the day – with all eyes now on the Strait of Hormuz for the first signs of safe LNG transit.
However, rumours abound that an exodus of ships through the waterway over the coming days remains a question-mark, with the Iranian regime still claiming full control – this will have to change ASAP if today’s optimism is the be sustained.
For now, traders are glued to tracking-data, monitoring which vessels are attempting to transit (and if they do so safely!)
To reiterate, not a single LNG vessel has transitted the Strait of Hormuz since 28th Feb – so early movements will be a fundamental driver of prices this week.
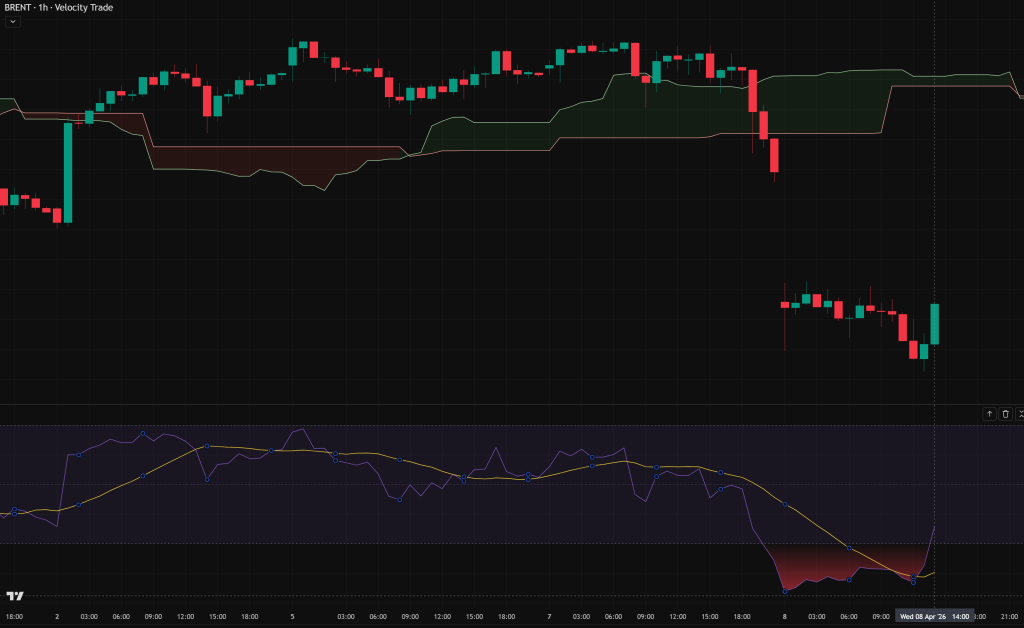
On other markets, equities have surged as investors piled back into stocks, gilts have risen (yields have fallen), and brent crude gapped down by $7 to start the day well below the $100 psychological level (please see chart below).
So, in the short term, markets are down, and the coming days should bring good opportunities to hedge the front-months whilst the market is in this dip.
However, looking forward, Trump’s original reasons for the offensive remain unresolved – the Iranian regime are still in control; the regime’s stocks of enriched uranium are still out-of-sight; their missile and drone capability is still very much in place.
So, will the ceasefire hold?
Well, Israel is still pounding Lebanon, and Iran was still firing missiles at its Gulf neighbours this morning (most notably, the East-West Saudi pipeline).
So, the coming days will establish if the truce has legs – or if the ceasefire is just a hiatus (in advance of the still-threatened US ground invasion).
In other fundamental news, the summer maintenance season is nearly upon us – so, Norwegian capacity is expected to see a slight decrease this week (beginning Thursday).
Right now, European storage fullness is at 29% versus the 5-year average of 38%.
Monthly Day-Ahead Averages for the month so far are holding steady at 124p/therm.
ELECTRICITY & CARBON
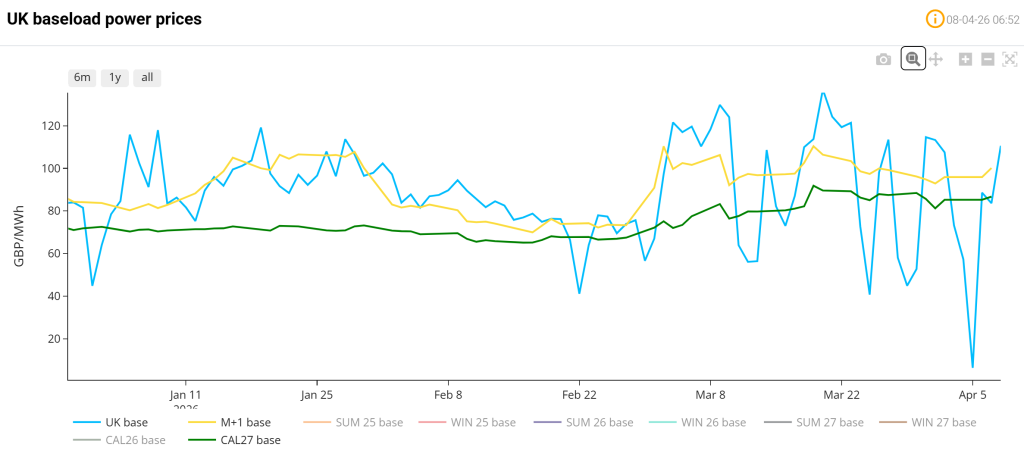
The chart below details UK electricity Day-Ahead (blue)/Month-Ahead (yellow)/CAL-27 (green).
It shows nicely the heightened volatility of near-term delivery since 28th Feb versus only very small changes in delivery prices further out.
This discrepancy, of course, reflects an underlying sentiment amongst market participants that the prevailing geopolitical chaos is not expected to last.
UK electricity prices remain at a significant discount versus gas prices (given summer conditions/improved renewables outputs/falling gas-for-power burn).
On the Carbon side of things, Dec-26 UKA delivery remains uncoupled from gas volatility with prices touching levels that are 33% below those printed in mid-Jan amid fears that Trump’s war on Iran is slowing global economies (and, in so doing, Industrial outputs).
At the time of writing, UKA mid-price Dec ’26 delivery is at £42/tn (and the spot is at mid-40s).
Since the US/Israeli offensive began, gas price falls are met with rising UKAs – and vice versa.
Monthly Day-Ahead Averages for UK electricity for the month so far remain at £86/mwh.