Diplomacy on the part of Pakistan to bridge the yawning divisions between the US and Iran persists.
However, Trump’s decision not to send his envoys on Saturday to Islamabad (citing a waste of time and cost) reflects (surely) his being content to see the Strait of Hormuz still closed for business.
He’s suggested instead that Iran can phone the US if they want to negotiate.
The Israel/Lebanon ceasefire hasn’t stopped Israel from killing 14 civilians in bombing raids over the weekend, and warning residents to leave towns beyond the Israeli’s percieved “buffer zone”.
In addition, Israeli attacks on Gaza have killed another 4 Palestinians (in addition to the 73,459 killed up to and including 6th Apr versus around 2,223 Israeli civilians).
Amidst the ongoing death and destruction, another attempt was made on Trump’s life yesterday – he survived, stating afterwards “I wasn’t worried. I understand life. We live in a crazy world”.
So, how are markets reacting today?
Well, they’re drifting sideways for now, as market participants try to assess if/what/when/how/why this conflict will end – though it’s worth remembering that Trump first suggested the war was nearly over as far back as 8th March.
7 weeks later, the regime is still in place (but with different personnel), and Iran still retains its enriched Uranium.
Iran has stumbled upon its being able to weaponize proximity to the world’s most important shipping route – and the US have laid siege, with an armada of 28 warships anchored in the Gulf.
Across the globe, countries are nervously watching and waiting as global resources tighten amid the supply squeeze.
In the short term, the Asian countries most impacted include Japan, South Korea, India, China, Pakistan, Bangladesh, Gulf States (Saudi Arabia, UAE, Qatar, Kuwait, Iraq) and, of course, Iran.
However, as the weeks wear on, competition for restricted global supply will overheat world markets – demand will outstrip supply, and prices will inevitably rise.
Amid the worry and gloom, the optimism of the US equity markets continues to astonish, with the S&P 500 in rude health (now 4% higher than it was when the conflict began).
Meanwhile, western consumers and businesses beyond the US borders are starting to feel the pinch, with unprepared economies lacking any fiscal room for manoeuvre (and monetary policy mostly restricted by inflation).
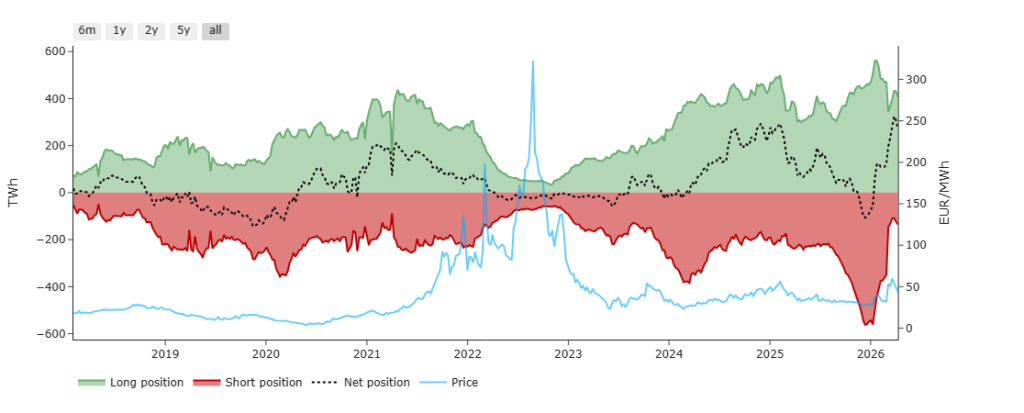
On the open-interest side of things (a good barometer of market sentiment), for the week ending 17th Apr, investment funds again reduced their net long positions on European benchmark gas forwards (TTF), but only by 4% – so whilst long positions are being closed, the rate of closure has slowed (so the heavy-money still believes prices have upside potential that justifies taking the risk of holding long positions).
Accordingly, please see chart below detailing position of investments funds vs TTF prices.
European storage fullness is at 31% versus the 5-year average of 39% – so not too far off the pace, and no need for panic stations yet.
On the trading side, FLEX clients are all but closed-out for May in the hopes that, come June, the Strait will re-open and essential LNG transit will have been restored.
Monthly Day-Ahead Averages for the month remain are holding steady at 113 p/therm (or 3.9 p/kwh exc. non-gas).
ELECTRICITY & CARBON
Thankfully, UK electricity prices have been significantly less volatile than gas prices since the US/Israeli offensive began back on 28th Feb.
Suffice as to say, given summer conditions (improved renewables/lower gas for power burn), UK electricity prices remain comfortably below the psychological level of £100/mwh.
Today’s UK electricity generation mix is neutral in nature – specifically, renewables are contributing 28%, thermal at 20% (gas and coal) and low carbon at 30% (nuclear and imports).
On the trading side, FLEX clients are all but closed-out for May in the hopes that, come June, the Strait will re-open and essential LNG transit will have been restored.
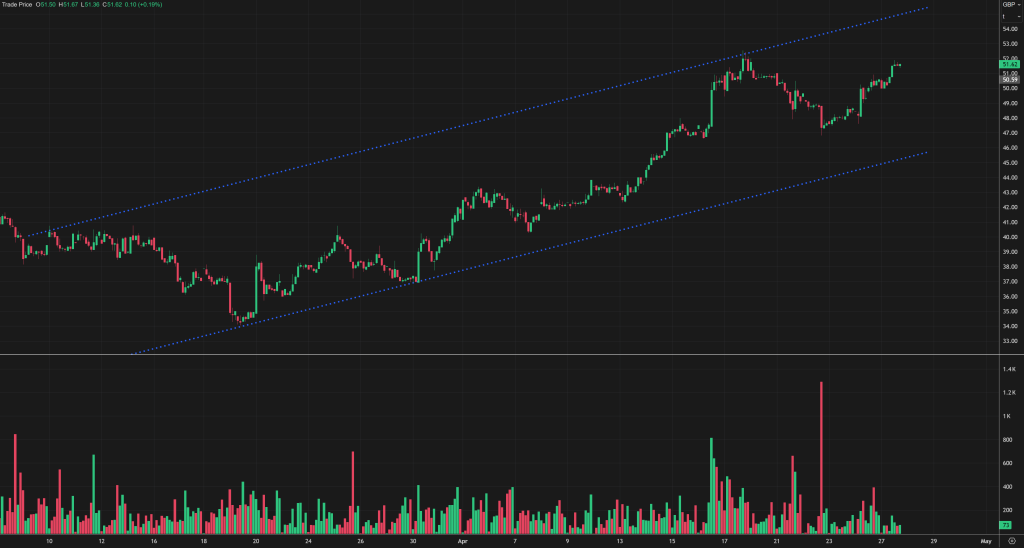
On the Carbon side of things, Dec-26 UKA delivery began the conflict heavily correlated to gas markets – so when gas prices fell, UKAs rose (and vice versa).
However, as of 19th Apr, we increasingly see a correlation with global equity markets which continue to enjoy a strong, tech-led rally.
At the time of writing, UKA mid-price Dec ’26 delivery is back up to £51.47/tn (and the spot is at mid-50s) – please see chart below.
Monthly Day-Ahead Averages for UK electricity for the month are holding steady at £89/mwh (or 8.9 p/kwh exc. non-energy).