As we feared, notwithstanding Trump’s regular updates that all is well and the end of the war is nigh, the Strait remains closed (in the main) and world economies continue to look on with heightening anxiety as each day/week/month that passes.
Belief persists amongst market participants that, eventually, Trump will be forced to back down and accept a MOU (Memorandum of Understanding) that kicks Iran’s nuclear capability can down the road.
But, for now, his Truth Social content posted in the early hours of the morning shows Iran on a map of the Middle East draped in an American flag – not surprisingly, given Trump’s unwillingness to play nice with the Iranians, they keep walking away from negotiations.
Today, despite last week’s talk that a deal was all but finished, hostilities have flared up again with an Iranian missile attack damaging Kuwait’s airport, and the US carrying out strikes across positions near the Strait of Hormuz.
Trump is stating that Iran has agreed to not have a nuclear weapon, and that Iran’s Ayatollah is involved in ongoing negotiations – not surprisingly, traders are increasingly unwilling to suspend their disbelief.
Israel’s role in making peace impossible has featured more over the last few days.
The US Administration wanted everybody to know that Trump had seemingly managed to convince Israel not to attack Beirut to avert further escalation.
Nonetheless, Israel continues to rain bombs on Southern Lebanon.
In short, the US Administration still hasn’t managed to put the genie back in the bottle since the US/Israeli offensive began 96 days ago.
We’re now more than a month into the storage injection season, and whilst LNG from the US/Canada/Tortue/Congo/Nigeria/Malaysia is serving Europe’s supply requirements, the Strait closure is keeping Qatar’s LNG out of the global market.
Today, prices are marginally up off the back of disappointment that the US/Iran have yet to rech a deal that will open the Strait, as well as forecasts of cooler temperatures across Europe (which will increase heating demand).
In other news, the European Commission’s latest gas market report called for a review of current gas storage rules but fell short of proposing any new measures to intervene in the market – this has inevitably focussed minds on the need to refill storage ahead of Winter-26.
At the time of writing, European storage fullness is at 41% versus the 5-year average of 55%.
Market participants are constantly looking for signs that the Strait is reopening – and so reports of an empty LNG tanker heading towards the Gulf of Oman today (the fifth such vessel in the past week) is giving some hope that ships may be positioning to load cargoes from the Persian Gulf.
We see no reason to believe this to be true (given that neither the US nor Iran looks likely to blink first).
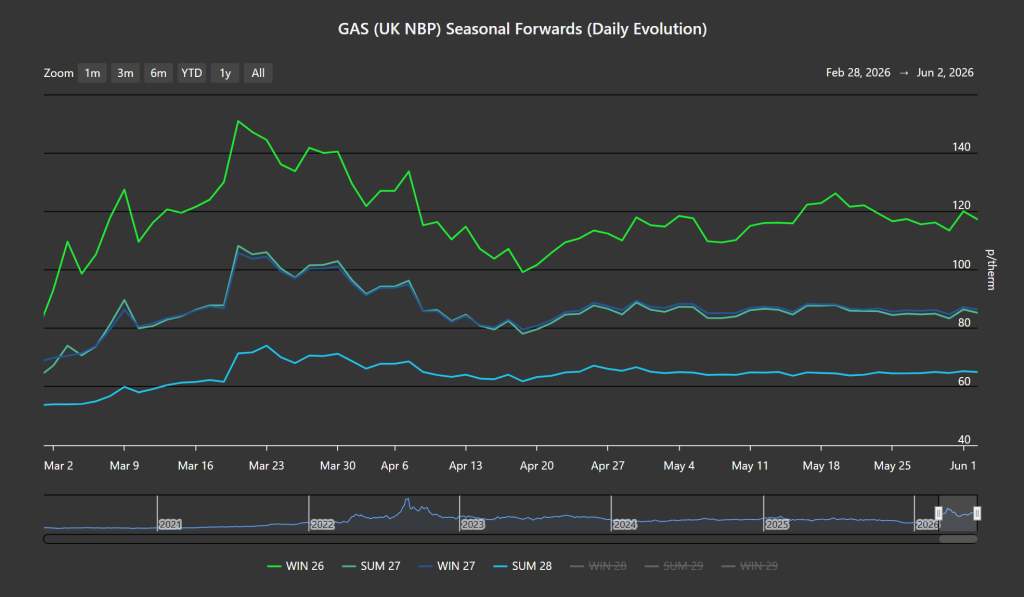
As per the chart below, Seasonal Forwards began to flatten out as of 24th April or so – reflecting that, noise aside, the market is just treading water pending a resolution to the crisis.
On the FLEX side, as has been the case all summer, traders will be looking to trade the front-month and/or balance of Summer-26 prices in the dips as the month progresses – pending a final resolution to the crisis, after which prices will fall steeply.
Monthly Day-Ahead Averages for May came in at 116.355 p/therm (or 3.97 p/kwh).
Monthly Day-Ahead Averages for June so far are at 118.967 p/therm (or 4.06 p/kwh exc. non-gas).
ELECTRICITY & CARBON
UK electricity prices have been significantly less volatile than gas prices since the US/Israeli offensive began back on 28th Feb – primarily due to summery conditions, solid renewables outputs (meaning lower gas-for-power generation).
Today’s UK electricity generation mix is bearish in nature – specifically, renewables are contributing 47%, thermal at 12% (gas and coal) and low carbon at 19% (nuclear and imports).
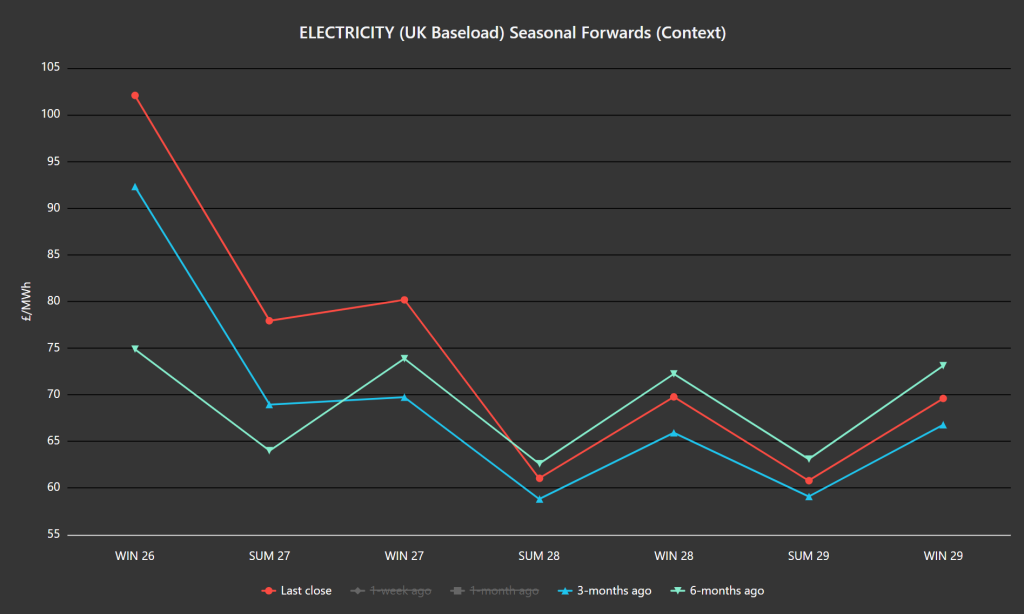
The chart below details Last close Seasonal Forwards versus 3-months ago and 6-months ago.
For FLEX buyers looking to hedge budget certainty further down the curve, it’s interesting to note that despite the ongoing Gulf crisis, available prices for Summer-28 and beyond are lower than than they were 6 months ago (at the end of ’25) – this certainly isn’t the case with gas prices.
On the Carbon side of things, Dec-26 UKA delivery began the conflict heavily correlated to gas markets.
However, correlation shifted to equities throughout March (which continue to enjoy a strong, tech-led upwards momentum).
At the time of writing, UKA mid-price Dec ’26 delivery is at £56.75/tn (and the spot is at mid 55s) amid rumours that the EUETS/UKETS linkage looks increasingly likley (meaning UKETS will need to rise to parity).
On the FLEX side, as has been the case all summer, traders will be looking to trade the front-month and/or balance of Summer-26 prices in the dips as the month progresses – pending a final resolution to the crisis, after which prices will fall steeply.
Monthly Day-Ahead Averages for May came in at £103.069/mwh (or 10.307 p/kwh exc. non-energy).
Monthly Day-Ahead Averages for June so far are at 89.968 (or 8.997 p/kwh exc. non-energy).