It’s been a strange week on the markets – illiquid and spiky.
Market participants remain spooked by the on/off nature of the US/Iran “conflict”.
Of course, more than any other key driver right now, we’re obsessed by traffic through the Strait of Hormuz – it’s proving tricky to track just how many vessels are making it through (as cargoes are understandably doing their best not to draw attention to themselves!)
Whilst transits through the waterway have risen since the MoU was signed on 17th Jun, they nonetheless remain well below the roughly 130 daily crossings that was the norm, pre-war.
As far as we can tell, at least 45 vessels crossed the Strait on Wednesday, up from 34 on Tuesday.
Yesterday, we think 54 ships made it (29 heading into the Persian Gulf, and 25 destined for the Indian Ocean).
To date, at least 49 Iranian attacks on commercial vessels have been recorded across the waterway since 28th Feb when hostilities began.
Front-month prices are set for their first weekly gain in four weeks (up round 8% w-o-w), as ongoing disruptions to Middle East gas flows increase competition for alternative LNG cargoes.
Specifically, whilst crude oil tanker traffic through the Persian Gulf has improved following the interim US-Iran peace agreement, LNG exports remain more constrained.
Even though Qatar has indicated it will increase LNG exports in the coming weeks, its extension of force majeure on some shipments to Asia and Europe is inevitably lending support to near-to-mid term delivery prices.
Notably, European nations seem increasingly resigned that transit fees will need to be paid to Iran and Oman, whilst the US and Gulf Arab states maintain that such charges are inconsistent with international maritime law and will set a dangerous precedent.
European governments are also urging Iran and Oman not to discriminate between ships based on nationality and are advocating for an international coalition to support mine-clearing operations in the Strait – however, at the time of writing, Iran remain reluctant to work toward a peaceful outcome.
In other news, the UK system remains comfortably supplied, though reduced Norwegian imports (due to seasonal maintenance) are inevitably reducing flows and lending support to front-month prices.
Summer competition for LNG cargoes has intensified as stronger demand from Asia and Egypt continues to attract volumes away from Europe.
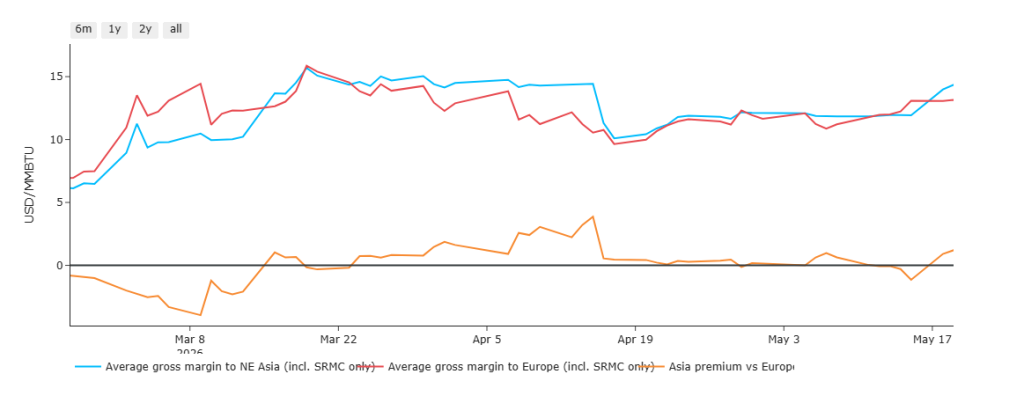
As per the chart below, beginning mid-March, cargoes are achieving better profits heading to Asia (which is entirely down to the ongoing closure of the Strait).
As such, the proportion of US LNG exports heading to European terminals has dropped off significantly, reinforcing concerns over stroage replenishment in time for the onset of the Winter-26 heating season.
During the week ending 26th Jun, investment funds reduced their net long positions by 16% (after reducing them the previous week) – so, net long positions are falling, but the rate of bearish activity amongst speculators has slowed.
Like all market participants, investment funds remain cautious, waiting to see first whether the resumption of traffic through the Strait of Hormuz will trigger a rebound in European LNG imports before selling in more significant volumes.
And so, for the time being, week-on-week, month-on-month, prices trade unpredictably in a 30% range depending on which way the US/Iran wind blows.
All noise aside, Seasonal Forwards are down all the way down the curve versus 1-month ago and 3-months ago, but up verus 6-months ago.
On the FLEX side, traders continue to buy in the dips (as we have thankfully throughout the middle of this week) – however, at the time of writing, markets are finishing the week with a bullish rally.
UK gas Monthly Day-Ahead Averages for June finished at 109 p/therm (or 3.7 p/kwh exc. non-gas).
UK gas Monthly Day-Ahead Averages for July so far are at 104 p/therm (or 3.55 p/kwh exc. non-gas).
ELECTRICITY & CARBON
Summery conditions and solid renewables outputs (meaning lower gas-for-power generation) are keeping a lid on UK electricity prices.
As you’d expect, today’s UK electricity generation mix is bearish in nature – specifically, renewables are contributing 54%, thermal at 8% (gas and coal) and low carbon at 23% (nuclear and imports).
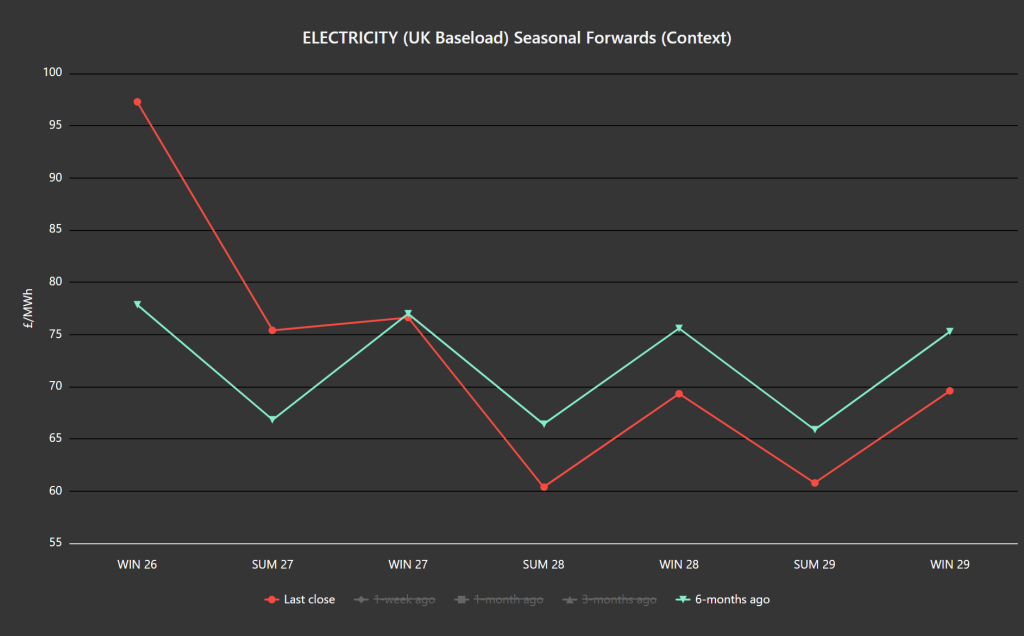
The chart below shows just how much value down the curve (beginning Summer-28) has improved versus 6-months ago – whereas the front 2-Seasons are as high as a 21% premium, and Winter-27 is at parity.
On the FLEX side, traders continue to buy in the dips (as we have thankfully throughout the middle of this week) – however, at the time of writing, markets are finishing the week with a bullish rally.
On the Carbon side of things, its been sideways price action for the last couple of weeks amid whispers that a potential broader EU policy shift may already be underway (favouring global competitiveness over the limitations of climate action).
Mid-price Dec-26 UKA delivery is now at £56.85/tn (and the spot is at early 55s).
UK electricity Monthly Day-Ahead Averages for June achieved £93.5/mwh (or 9.35 p/kwh exc. non-energy).
UK electricity Monthly Day-Ahead Averages for June so far is at £71/mwh (or 7.1 p/kwh exc. non-energy).