It’s been a week of Trump flip-flops (be they deliberate or otherwise), and markets have struggled to keep up.
Near-term delivery gas prices went on a march northwards beginning last week off the back of colder weather across Europe, as well as the spectre of the “Siberian Express” system threatening to bring with it sub-zero temperatures into February.
Thereafter, into last weekend, Trump threatened Europe with retaliatory tariffs if they didn’t support his bid for Greenland, then Europe made combative noises back – which have taken the markets higher still this week off the back of fears that a US/Europe trade war would impact supply security/ industrial outputs.
Then (as is increasingly his MO these days), Trump abruptly turned down the heat, and markets have been left reeling – unsure of their direction bias.
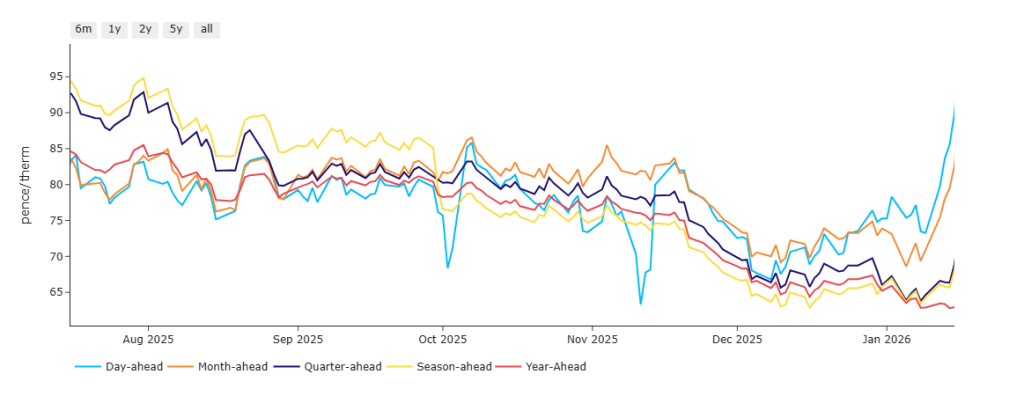
So, as per the chart below, Day-Ahead/Month-Ahead have spiked approx. 15% this week, but Quarter-Ahead/Season-Ahead/Year-Ahead have remained relatively flat – reflecting the markets belief that prevailing chaos is only adding value to very near-term delivery, whilst mid-term is holding it’s ground.
Prices remain high and wintry this morning, despite the UK system opening long (supply outstripping demand forecast).
After testing seven month highs (intraday) during yesterday’s session, Month-Ahead prices are consolidating sideways at the time of writing.
Looking more long-term down the curve, the front 3-Seasons are up approx. 20% versus the start of Jan ’25 – these sudden, volatile swings remind us just how exposed Europe’s gas system remains to geopolitical disquiet and any threats to the security of LNG transit.
Weather models across the industry show very little consensus – some forecasts point to temperatures near or above seasonal norms for early February, whilst others predict more windy, cold outbreaks.
Suffice as to say, intermittent cold spells across Europe, coupled with weaker than expected LNG send outs (driven by technical issues at European terminals), and a tad more competitive pressure from Asian markets have accelerated storage withdrawals and pushed European storage fullness below recent projections.
Stock inventories now stand at 48% versus the 5-year average of 72% – with a new projection doing the rounds of 22% by the time April rolls-around (assuming seasonal norm weather conditions).
So, as was the case last week, winter is still here and the bears will bite their nails until things warm up again.
Monthly Day-Ahead averages for the month are up to 85p/therm (or 2.9p/kwh) reflecting multiple daily closes above 100p/therm over the last week or so.
ELECTRICITY & CARBON
Electricity moves have mirrored gas volatility.
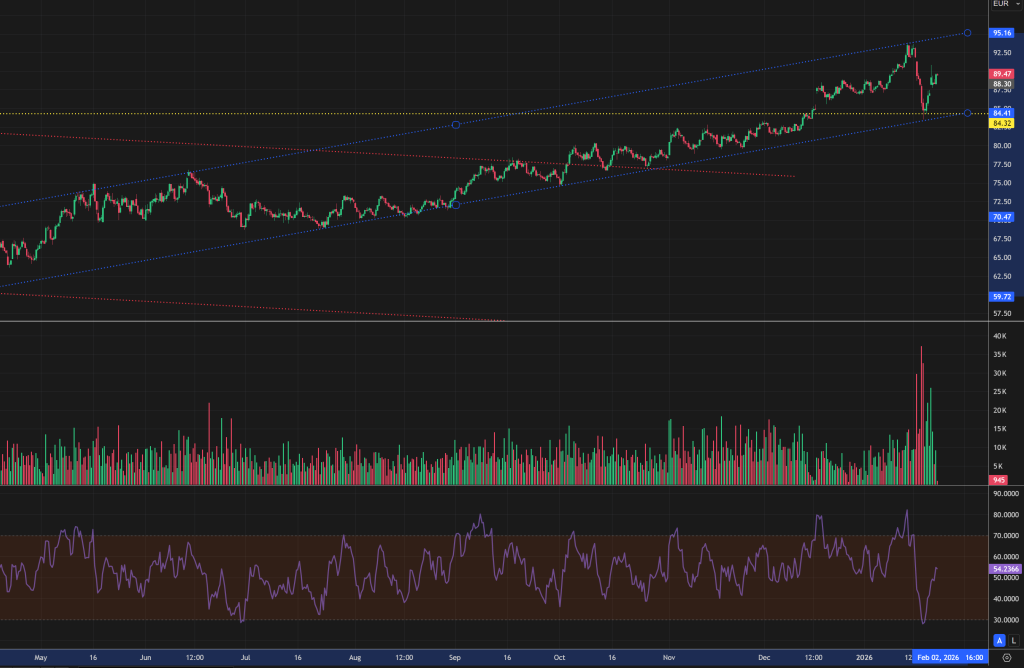
On the Carbon side of things, UKAs are increasingly correlated to EUAs following recent pronouncements by the EU that talks to merge UKAs and EUAs are going well.
As such, (and given already preominantly bullish drivers including fewer credits available at auction each fortnight than was the case in ’25 and a general reduction in free allocation being implemented across sectors for ’26 into ’27), Trump’s threats of tariffs on Europe heightened risk and EUAs/UKAs went to the moon last week!
However, when Europe threatened reciprocal tariffs, markets adopted a more bearish tone given that a US/Europe trade war would inevitably lead to lower industrial outputs.
But then, Trump backed off, and Carbon bounced – please see EUA chart below.
Compliance buyers (whose activity in the market is eclipsed by the investment funds) can only ride the waves and buy in the dips as best they can
Please note, UKA spot prices on the secondary market remain at an approximate £2/tn discount to Dec-26 delivery.
Today’s UK electricity generation mix is bearish in nature off the back of windy conditions – specifically, renewables are contributing 50%, thermal at 17% (gas and coal) and low carbon at 18% (nuclear and imports).
Monthly Day-Ahead averages for the month so far remain wintry at £93/mwh (or 9.3p/kwh exc. non-energy).