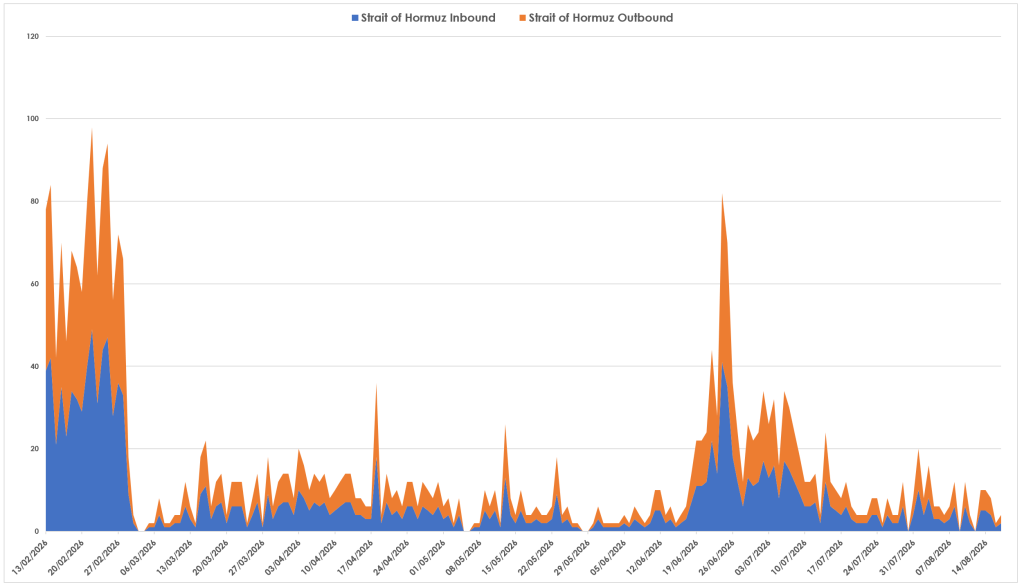
Market participants have become almost entirely focussed on vessel transit through the Strait of Hormuz – please see chart below.
As you can see from the graphic, traffic prior to the US/Israeli offensive (both inbound and outbound) was around 130 vessels/day.
In the weeks/months following 28th Feb, average daily transit (both inbound and outbound) dropped to below 3 vessels/day – until 9th Jun following the MoU (Memorandum of Understanding), after which the daily average shot up to 9 vessels/day.
However, once it became clear back in mid-July that hostilities had resumed, the daily average fell back down to 2 vessels/day.
This week so far, the daily average has fallen to less than 1 vessel/day.
43 days remain until the onset of Winter-26, with European storage fullness at 61% versus the 5-year average of 75% – which means, given the current rate of injection, gas inventories are unlikley to get much beyond 70% full before the onset of the heating season come November.
Also in Niovember, it’s widely expected that the Democrats will take the House of Representatives in the mid-terms.
For his part, Trump is giving the impression he’s indifferent to the outcome of the mid-terms, stating that he’s in no rush to resolve the US-Iran dispute (despite his falling popularity at home in the US).
Greek shipping company Dynagas transported €2.35 billion of Russian LNG to European customers during the first seven months of 2026 – Dynagas accounted for 35% of LNG shipments from Russia’s Arctic Yamal facility to the EU – and so, with the EU determined to end Russian LNG imports by 2027, markets are starting to price-in an inevitable impending gas shortage across Europe.
Looking forward, for clients with Winter-26 open volumes, we’ll look to advise on potential intraday dips and hedging opportunities over the coming days/weeks – but with only 43 days of the injection season remaining before the onset of Winter-26 delivery, time is running out for the Strait of Hormuz to re-open.
Monthly Day-Ahead Averages for August so far are at 143p/therm (or 4.88p/kwh exc. non-gas) – the highest level we’ve seen since Dec ’23.
ELECTRICITY & CARBON
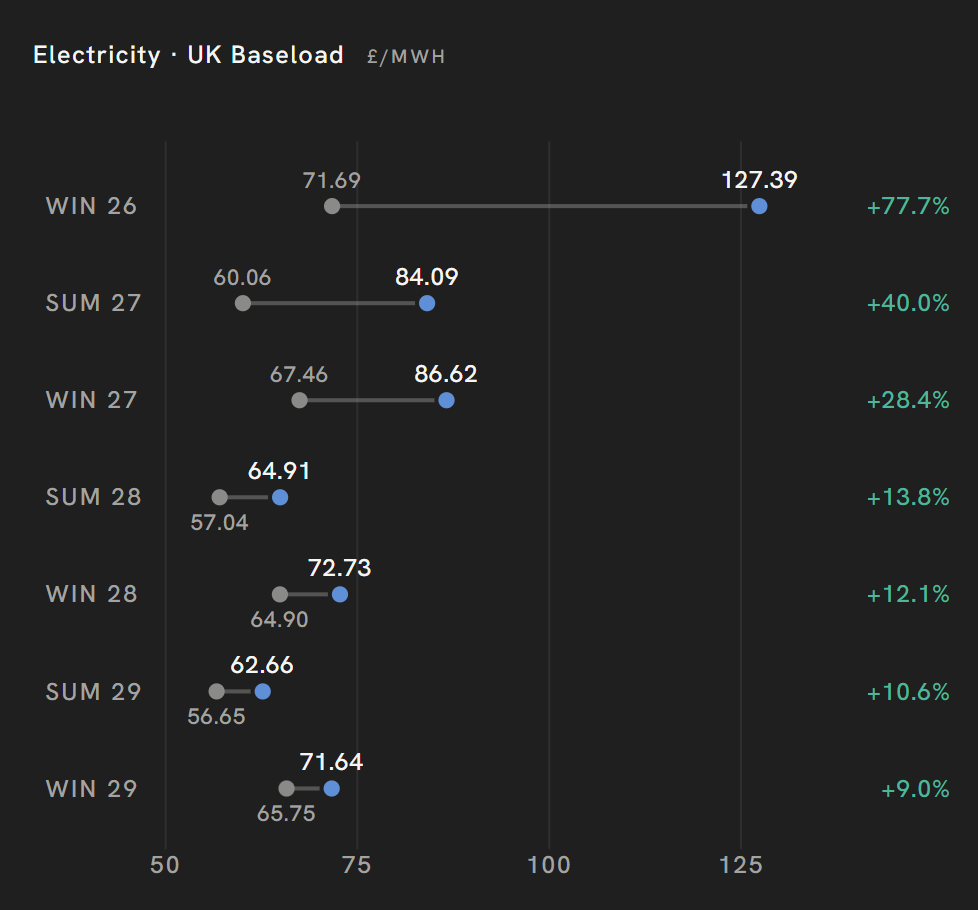
The graphic below is our half-year curve shift – a quick-glance volatility indicator reflecting the percentage changes of the front 7-Seasonal Forward prices versus 6-months ago.
As you can see, the lion’s share of the risk-premium caused by Trump’s war on Iran remains front-loaded.
Today’s UK electricity generation mix is bearish in nature due to strong renewables outputs (not that it’s having any bearish effect given the overwhelming impact of looming global gas shortages) – specifically, renewables are contributing 55%, thermal at 17% (gas and coal) and low carbon at 18% (nuclear and imports).
On the Carbon side of things, mid-price Dec-26 UKA delivery sits at at £58.82/tn (and the spot is at mid 572s) – price action has become directionless amid surges in near-term gas delivery prices (and impending industrial demand destruction).
Looking forward, for clients with Winter-26 open volumes, we’ll look to advise on potential intraday dips and hedging opportunities over the coming days/weeks – but with only 43 days of the injection season remaining before the onset of Winter-26 delivery, time is running out for the Strait of Hormuz to re-open.
UK electricity Monthly Day-Ahead Averages for August so far are also at £117.7/mwh (or 11.77 p/kwh exc. non-energy).