Are the speculative bulls and the doomsayers losing their grip on the markets (with 34 days until the onset of Summer-25)?
European gas markets held their downward bias yesterday following a warm and windy weekend.
LNG supplies to Europe are in rude health amid depressed Asian LNG imports knocking on the door of a 2-year low.
Whilst temperatures are set to drop at the tail end of February and start March below seasonal norms (supporting Day-Ahead prices), this doesn’t look to be a lasting reversal in temperatures as they are set to move back above seasonal norms by the end of the first week of March – though of course weather forecasts flip-flop day to day!
The warm and windy conditions over the last few days are easing storage pressure with levels moving down less than 1% over the weekend.
That lack of withdrawals has widened the gap between 2025 and 2021 storage levels to only -2.5% – so storage is not the headline the bulls would have us believe…
At the latest reading European storage levels are measuring at 40.76% – withing touching distance of 7-year average.
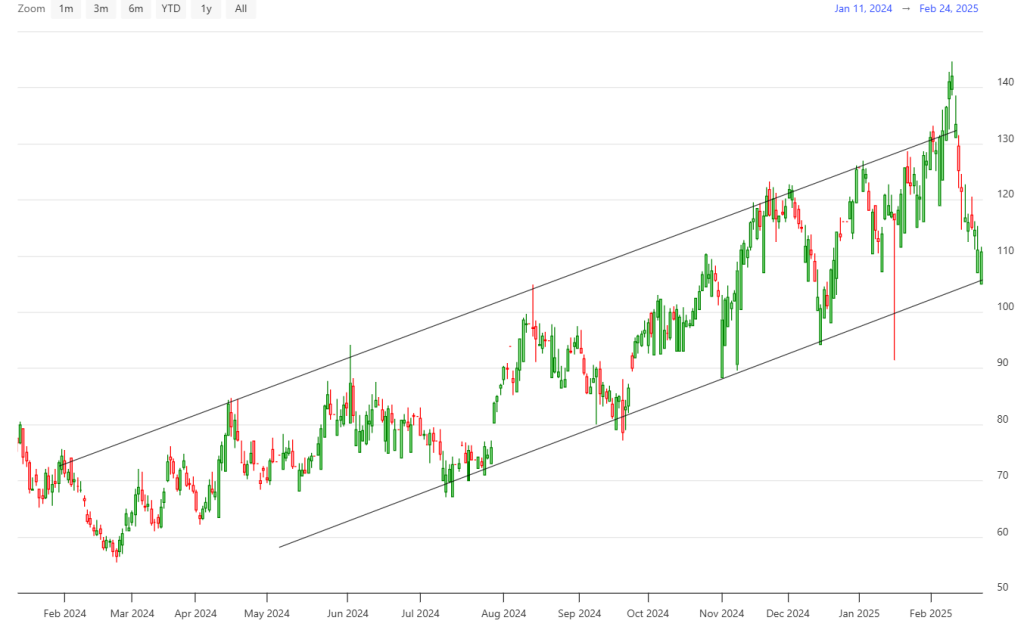
The Month-Ahead bullish trend channel which defined the perameters for Summer-24’s gradual march northwards is still being observed (please see chart below).
The price-action is now re-testing the lower extremity of the trend-channel…will the prevailing bearish fundamentals be enough to bring about a break to the downside?
In the headlines this morning, a UN Security Council resolution calling for a “swift end” to the Ukraine/Russia conflict has added more weight to Trump’s determination to end the war (on his own terms).
France and the UK did not veto the measure – unsurprisingly, Russia and China backed it.
It looks increasingly likely that Trump’s transactional approach to ending the war is gaining ground – keeping pressure on prices amid (unconfirmed) rumours that a partial resumption of Russia’s gas flows would form part of the deal.
Monthly Day-Ahead averages for this month so far have fallen from the highs in the 2nd week at 137p/therm to 126p/therm (or approx. 4.3p/kwh excluding non-gas).
ELECTRICITY & CARBON
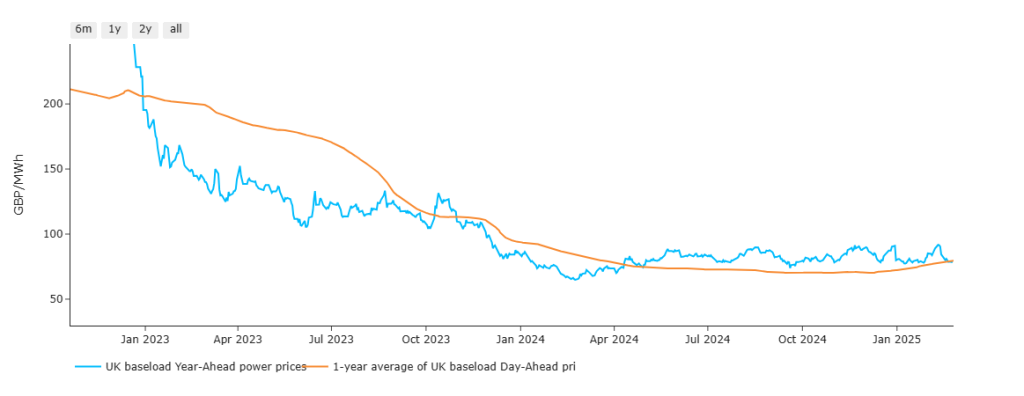
Notably, benchmark Year-Ahead prices versus Day-Ahead averages are at parity – reflecting surely reduced volatility, and a stabalisation down the curve with near-term prices less stretched (please see chart below).
It is expected today that the CEO of BP will formally announce an intention to scrap their renewable generation growth target (which was a 20x increase by 2030).
Instead, their intended u-turn will be to refocus on fossil fuels amid falling profitability reflecting a burgeoning lack of investment into renewables across Europe and the US.
With the CDU having won the German election, it’s expected that Germany will remain in the Paris climate agreement – but will likely favour market-driven policy over regulatory approaches (unlike their predecessors).
And so, slowly but surely, Trump’s determination to favour profit over renewables development is influencing policy across the globe.
The Carbon markets remain closely correlated to fossil fuel prices – so as you’d expect, EUAs and UKAs are on the slide.
Talk of Starmer’s intentions to merge EUAs/UKAs has gone from the headlines, and UKAs have resumed their bearish bias.
Prices (now at £40/tn) have fallen out of the bottom of the long-term bullish trend channel with a new descending channel having been confirmed (please see chart from our report on 21st Feb).
Today’s UK electricity generation mix is neutral in nature with renewables contributing 37%, thermal at 31% (gas and coal) and low carbon at 25% (nuclear and imports).
Monthly Day-Ahead averages so far for this month have fallen from a high of £119/mwh to £107/mwh (or approx. 10.7p/kwh excluding non-energy).