As has become customary on the part of the Trump Administration, market-moving geopolitical moves were made over the weekend (when markets were closed).
Not surprisingly, markets were significantly firmer at this morning’s open – Brent Crude Spot is retesting recent highs (currently at $118/barrel), and UK gas is back up to 120p/therm for near-to-mid-term delivery.
Front-month UK gas gapped higher at the open off the back of attacks on vessels across the Strait of Hormuz – with the US sinking several Iranian fast boats, and Iran firing warning shots at an approaching US warship.
Following the announcement last week that the UAE is exiting OPEC (and becoming more closely alligned with the US/Israel), the UAE was subsequently forced to defend a barrage of Iranian missiles over the weekend (15 of which were shot down).
In addition, QatarEnergy has extended force majeure through to mid-June given the stalemate that persists in the Strait of Hormuz (with Qatari LNG volumes stuck, and production on hold).
Footage of the Strait now shows thousands of ships stranded on either side of the waterway – no doubt an optic that the US Administration are tracking.
And so, Trump has announced “Project Freedom”, with a view to the US Navy helping to “guide” vessels on their way.
Not surprisingly, both vessel owners and, perhaps more importantly, vessel insurers remain unconvinced as to the viability of Trump’s latest gambit.
Bears would argue that signs the U.S. Navy is loosening Iran’s grip on the Strait of Hormuz, potentially opening up supply from the Middle East, is a positive development.
Bulls would counter that as long as there is no peace agreement between the warring factions, escalation is inevitable (given that a few more weeks of failed transit will mean real-world oil/gas shortages – so pressure and tensions are set to rise).
Fundamentally speaking, European storage fullness is at 34% versus the 5-year average of 41% – so not too far off the pace, and no need for panic stations (yet).
On the trading side, the immediate challenge facing some FLEX clients’ is June delivery – today, markets are up off the back of renewed hostilities and so traders will be looking to buy dips as the month progresses.
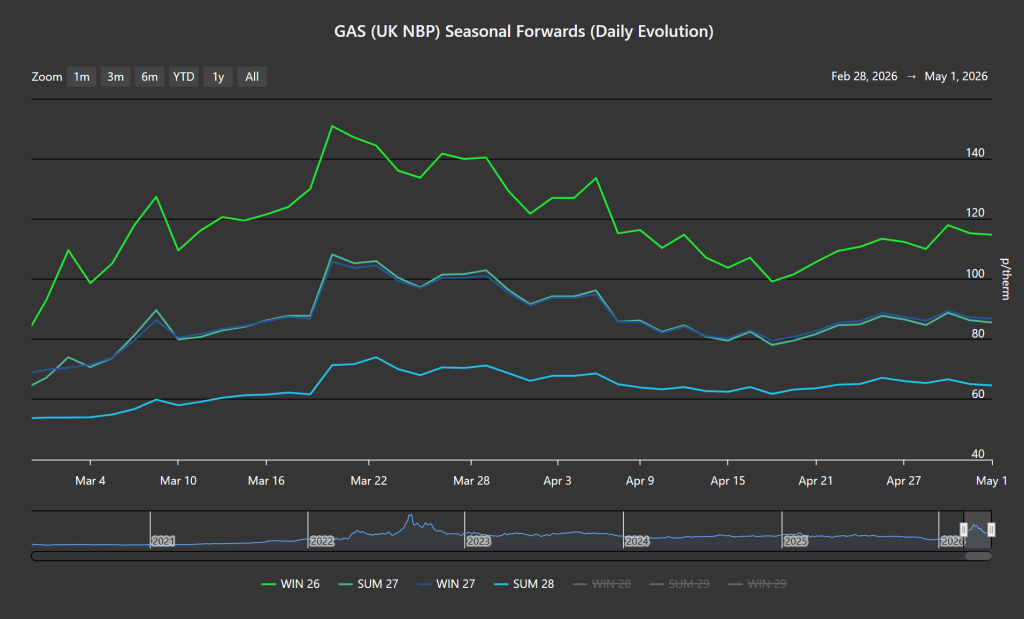
The Seasonal Forward chart below shows the evolution of the front-4 Seasons since the onset of the US/Israeli offensive – the curve remains heavily backwardated (with delivery prices further out at a discount to nearer-term delivery prices).
Winter-26 remains high and wide, Summer-27 and Winter-27 are at parity, and Summer-28 (and beyond) is only very marginally altered to those offered before the war (given an underlying belief amongst market participants that the crisis is temporary).
Monthly Day-Ahead Averages for April achieved 112.5 p/therm (or 3.8 p/kwh exc. non-gas).
Monthly Day-Ahead Averages for May so far are at 114p/therm (or 3.9 p/kwh exc. non-gas).
ELECTRICITY & CARBON
Thankfully, UK electricity prices have been significantly less volatile than gas prices since the US/Israeli offensive began back on 28th Feb.
Suffice as to say, given summer conditions (improved renewables/lower gas for power burn), UK electricity prices remain (in the main) below the psychological level of £100/mwh.
Today’s UK electricity generation mix is neutral in nature – specifically, renewables are contributing 37%, thermal at 24% (gas and coal) and low carbon at 24% (nuclear and imports).
On the trading side, the immediate challenge facing some FLEX clients’ is June delivery – today, markets are up off the back of renewed hostilities and so traders will be looking to buy dips as the month progresses.
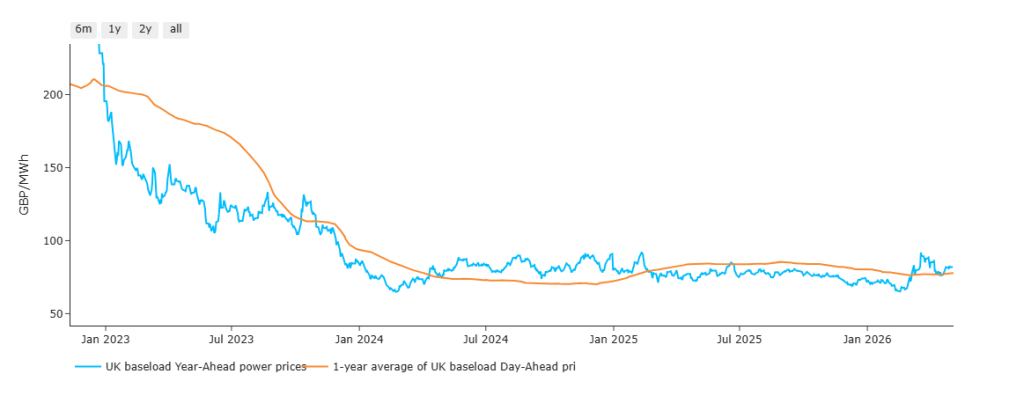
The chart below details UK electricity Year-Ahead prices versus the 1-Year Average of Day-Ahead prices.
In short, when the blue line is above the orange line, near-term delivery prices are at a premium to an average of the last 12 months.
As you can see, prior to the onset of the US/Israeli offensive, prices were enjoying a soft-landing heading into Summer-26.
Now, more than two months later (beginning 9th Mar), near-term delivery prices reflect resurgent global supply risks.
On the Carbon side of things, Dec-26 UKA delivery began the conflict heavily correlated to gas markets – so when gas prices fell, UKAs rose (and vice versa).
However, correlation has now seemingly shifted to equities, which continue to enjoy a strong, tech-led rally.
At the time of writing, UKA mid-price Dec ’26 delivery is at £49.99/tn (and the spot is at mid-48s).
Monthly Day-Ahead Averages for April achieved £86.70/mwh (or 8.67 p/kwh exc. non-energy).
Monthly Day-Ahead Averages for May so far are at £104.97/mwh (or 10.497 p/kwh exc. non-energy).